


Following a move to $32,000 earlier in the week,BTCwas fighting to hold above $29,000 in Tuesday’s session. The red wave that caught the bitcoin bulls also overcameETHwhich, as of this writing, has pushed prices down nearly 8%.
Bitcoin
After a strong start to the week, bitcoin traded lower again as the price fell below the $30,000 mark.
Tuesday saw SerovBTC/USD fall to an intraday low of $29,311.68, more than 7% lower than yesterday’s peak of $31,693.29.
After breaking through the $30,500 ceiling on Monday, price failed to penetrate the high resistance point at $31,550, the bear entry point.

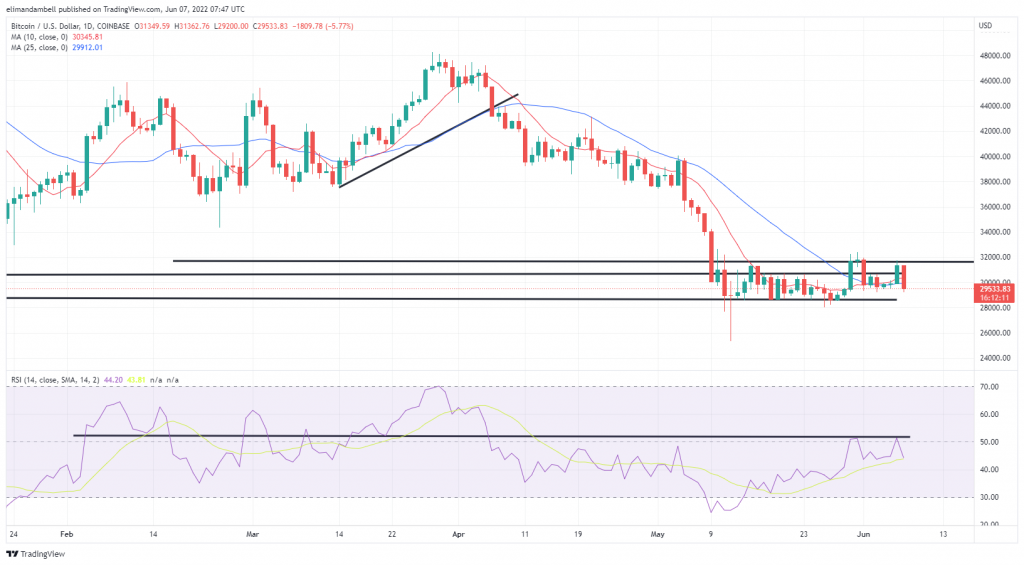
Looking at the chart, today’s candlestick looks like a bearish engulfing candle, which has cancelled out the precious 3-day rally.
Price is still trading above $29,000, but if this floor is broken, the target will likely be the $28,800 support level.
As of this writing, the 14-day RSI is at 44.20 and rapidly approaching its own support point at the 43.30 mark.
If this is broken, the bears will likely reach their price targets.
Ethereum
ETHcontinued its weekly decline, with today’s price falling to its lowest in nearly two weeks.
The world’s second-largest crypto token fell nearly $2,000 in the past 24 hours to its lowest price since May 28.
76} Tuesday’s intraday low ETH/USD fell to a bottom of $1729.41, falling below the $1,750 bottom in the process.
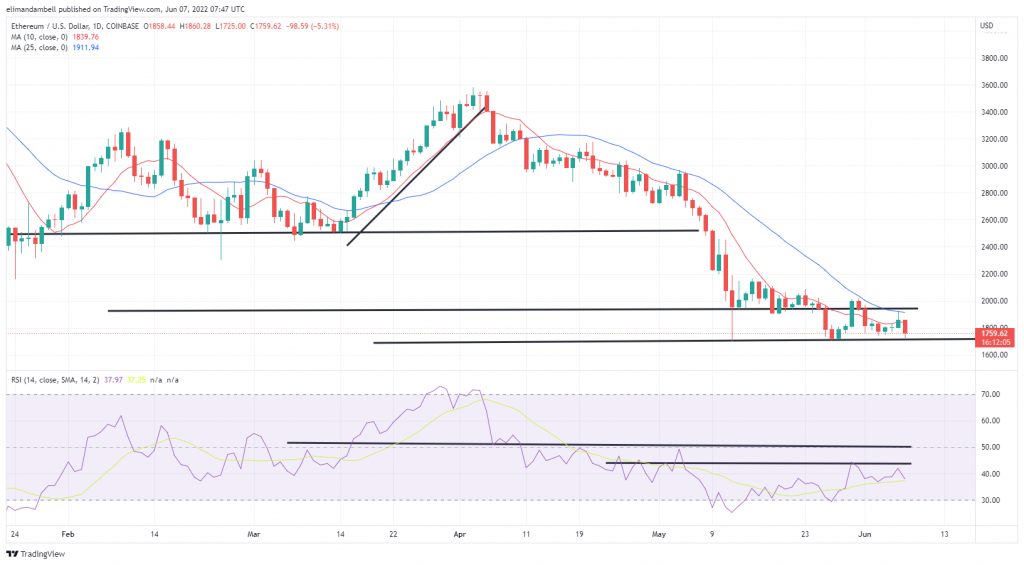
Since hitting this floor, the token’s price has since rebounded, and as of this writing, the asset is trading above support at $1761.81 trading slightly above.
Overall, prices are 6.71% lower than Monday’s highs, indicating increasingly bearish momentum.
If this pressure seems to extend, it is likely thatETHwill trade in the $1,600 range in the next few sessions.
Image credits: Shutterstock, Pixabay, Wiki Commons