

This is the June 2022 Monthly Market Insight Report by Bitcoin.com Exchange Subsequent reports will include a summary of crypto market performance, macro recap and market structure analysis.
Crypto Market Performance
The crypto market continued its downtrend asBTCandETHfell 30% and 44% respectively over the past 30 days
The macroeconomic outlook continues to be unfavorable for risk assets as high inflation combines with rising commodity prices and a tight US labor market. Additionally, crypto experienced a credit crisis as major borrowing/lending players such as Celsius, 3AC, and Babel Finance became insolvent.
Despite the large losses seen in BTCandETHhowever, several large assets have performed well. Of the top 50 assets by market capitalization, helium was the most positive performer, up 33% over the past 30 days; LEO was up 11.20%, while LINK remained mostly flat. The largest underperformers were AVAX, down 44%, Bitcoin Cash (down 39%), and Kronos (down 40%).
Macro Recap. Commodities under pressure despite central bank action
At this FOMC meeting, the Federal Reserve raised interest rates by 75 basis points for the first time since 1994. This was in response to the May 2022 CPI data, which remained high at 8.1% (the highest level since 1981). The labor environment in the U.S. remains difficult, with April figures (released on June 1) showing only a slight decline in the number of job openings to 11.4 million from a record high of 11.8 million in March. Chairman Powell has indicated that another 50-75 bps rate hike will be announced at the July 2022 FOMC meeting.
Commodity prices continued to rise amid tightening central banks, combined with supply chain issues and political instability. Crude oil led the way, with diesel futures reaching US$120 per barrel before stabilizing above US$105 in the latest trading session. Supply and demand continue to balance in the direction of higher demand. While high oil prices have destroyed some demand, supply remains tight due to supply chain constraints caused by sanctions on Russian exports.
Market Structure. Forced Capture is a sign of a local bottom.
BTCThe market saw two large scale forced sell-offs in one month: the first was the liquidation of assets by the Luna Foundation, which sold up to 80,000BTC; the second was the sale of BTCand sold a significant amount ofETHand other liquid assets; ETHand other liquid assets; the second was the credit crisis and liquidation of Celsius, 3AC, and Babel Finance. The crypto market capitalization fell $2.1T from the all-time high reached in November 2021.
This puts pressure on miners, who also face increasing electricity costs. As prices continue to fall, miners will find their profitability declining; according to Glassnode’s difficulty regression model, the “all-in sustaining cost” of mining is currently $17,800, which is roughly whereBTCwas traded late last week.
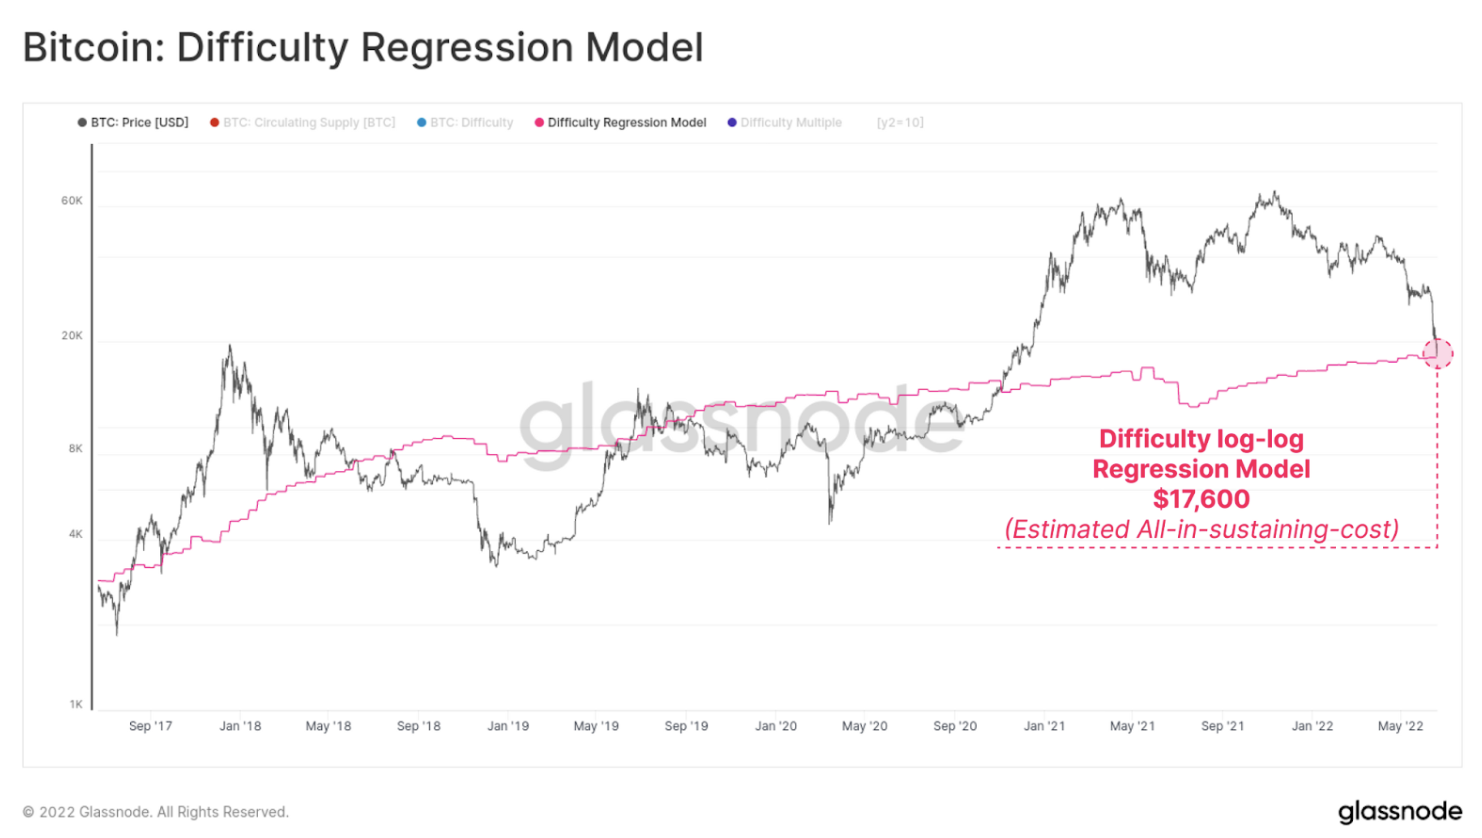
Bitcoin hash rates are already down 10% from their all-time highs, and unprofitable miners are already going offline.

One could argue that as profitability declines, miners will be forced to sell. The Pure Multiple (PM), shown in orange in the chart below, is an oscillator that tracks the revenue generated by miners The value of the PM is 0.35, which equates to 61% below the annual average in revenue. This is close to the levels seen in the 2014/2015 and 2018/2019 bear markets. At that time, miners saw a PM multiple of 0.31, which equates to a 69% earnings decline versus the annual average.
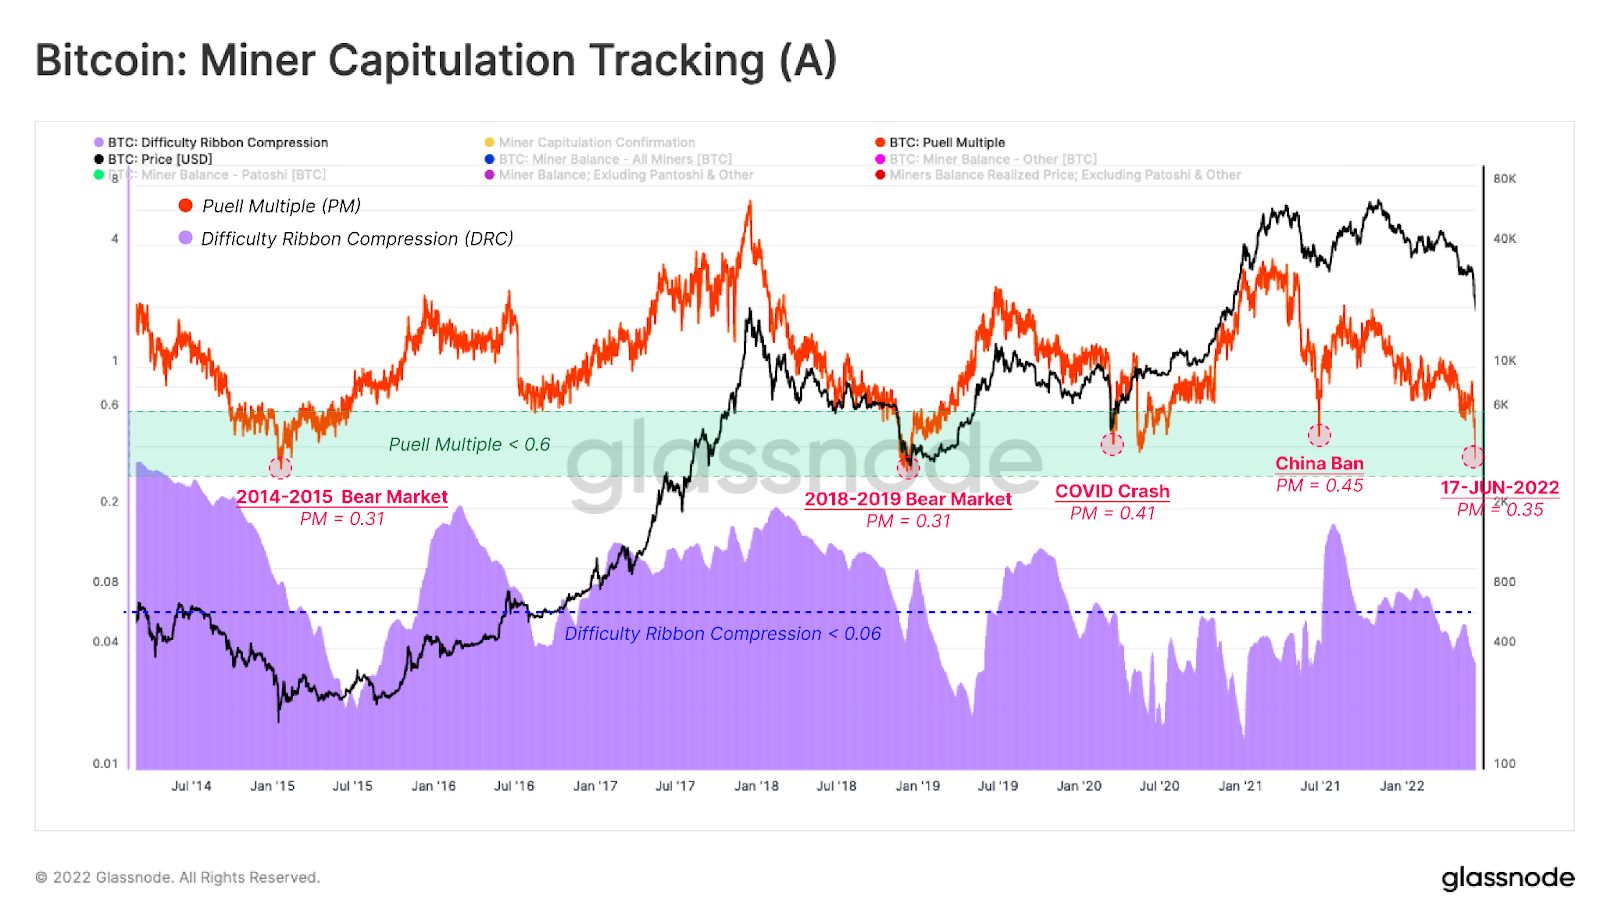
Difficulty Ribbon Compression (DRC), shown in purple in the figure above, is the miner’s stress model. This represents a mining rig going offline. There are many reasons why mining rigs go offline. Regulatory considerations, increased difficulty of the bitcoin algorithm, increased electricity costs, and of course, decreased profitability due to lower market prices. In the chart above, we can see a decrease in this metric, which represents fewer active rigs due to one or more of the aforementioned reasons.
Next, we will look at the long-time holder (LTH) cohort. As market participants’ capital decreases, LTH comes under stress. As shown below, the LTH cohort has seen a 178Kdecrease in total supply. Over the past month, there has been a supply of 178K BTC, which represents 1.31% of this group’s total holdings.

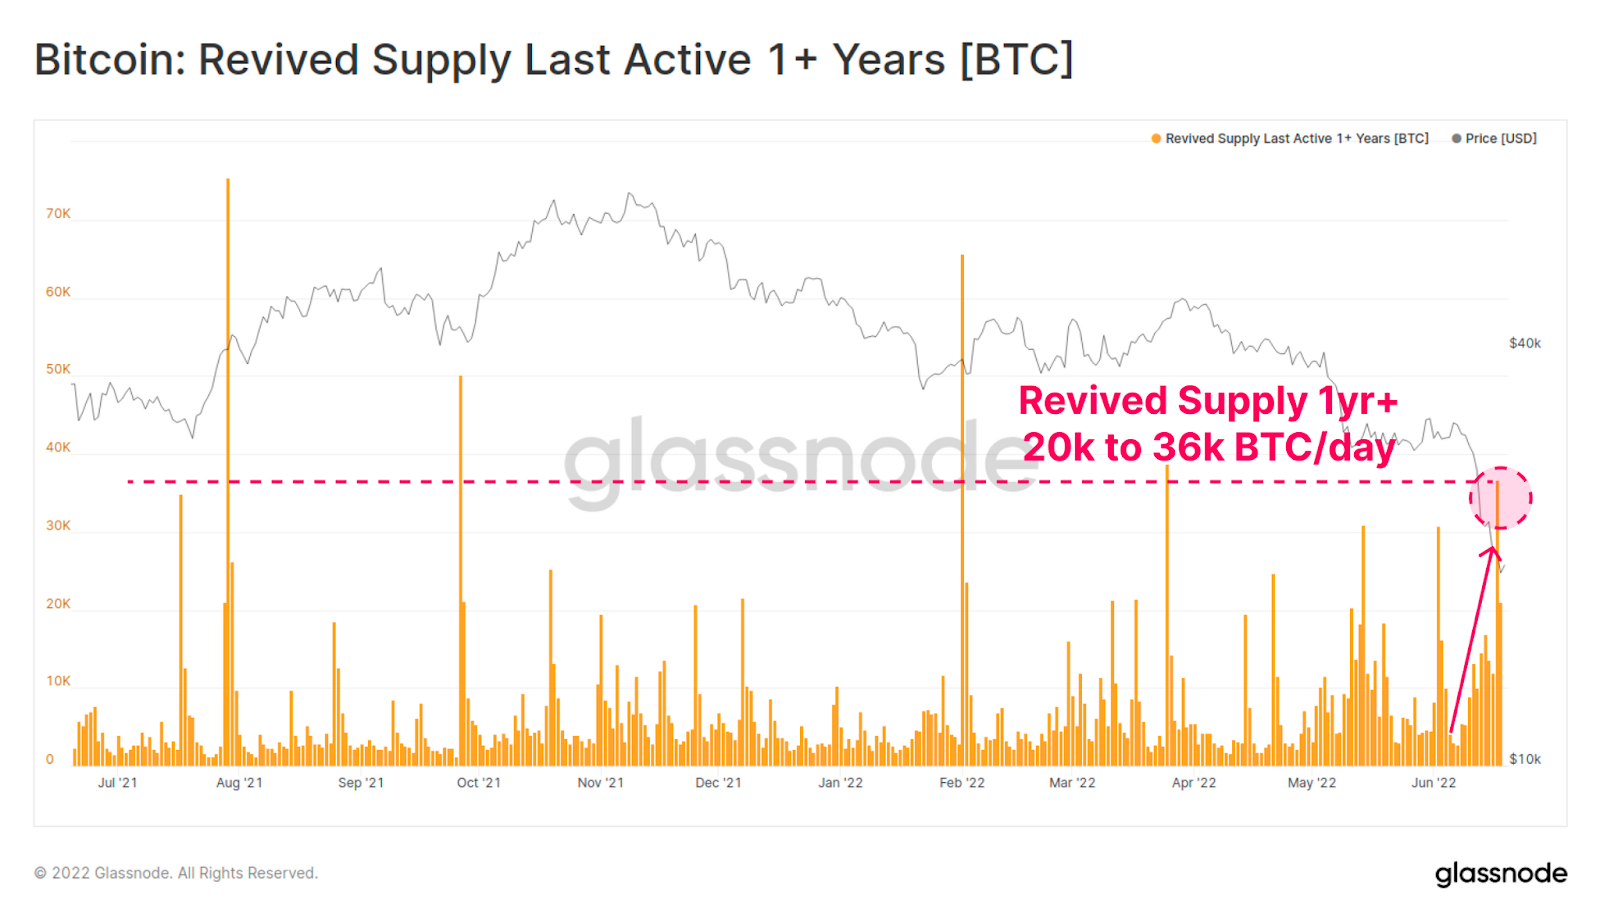
Another interesting indicator to understand the current selling situation is that old supply is coming back. As seen below, about 20-36K BTCper day is currently being revived, which is similar to the levels seen on April 22. This indicator can be viewed as a fear index, as current conditions indicate the need for long-term holders to sell their positions.
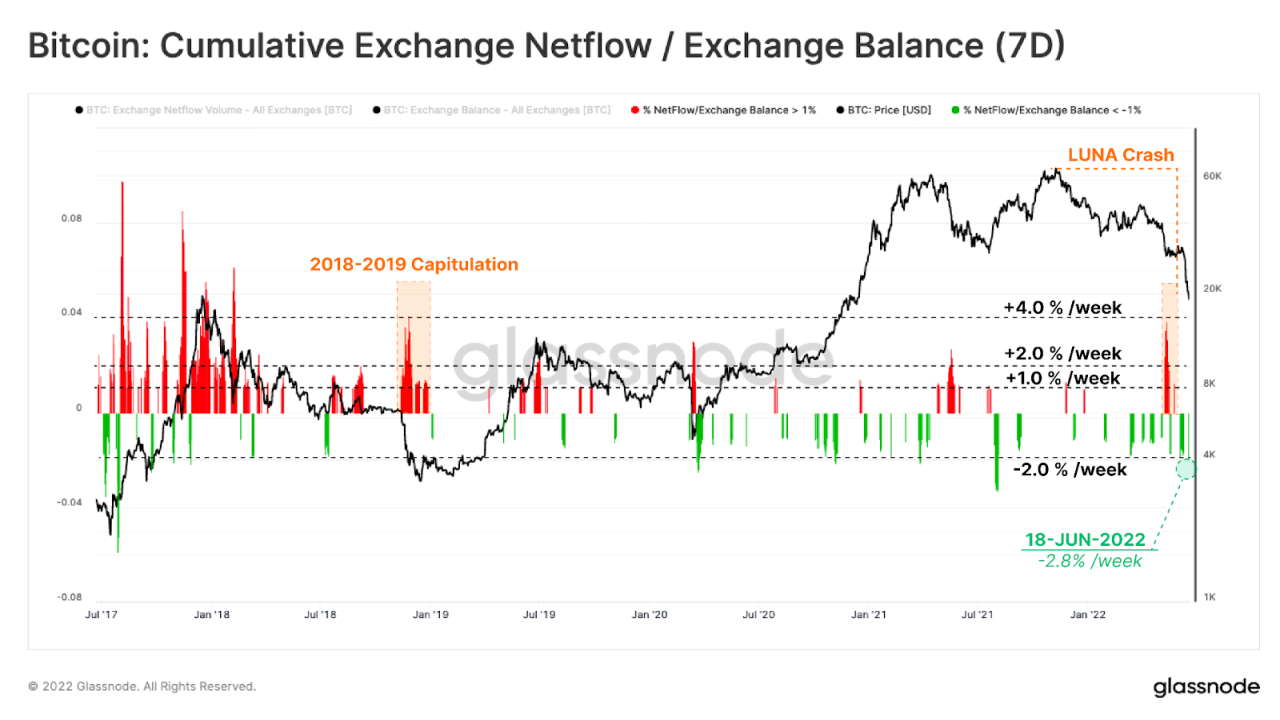
Finally, we will look at inflows and outflows from centralized exchanges, also called net flow exchange balances. When we see market inflows to an exchange, we assume that market participants are trying to sell their tokens. When we see market outflows from an exchange, we can assume that market participants are trying to retain their tokens.
Below we see that there was a strong market inflow in May 2022 on the back of the LUNA crash, with inflows reaching +4% per week (exchange balance). This was similar to the sell-off in 2018-2019 (>1% of exchange gains).
However, notice that the latest sell-off (June) shows an outflow of 2.8% per week. This is due to the peculiar nature of this sell-off. As the creditworthiness of some of the largest crypto players came into question, participants may have begun to move their tokens into self-custody, where there is less perceived risk.
In summary, the market experienced consecutive sell-offs in May and June 2022. These were driven by strong macroeconomic headwinds, but two black swan events (i.e., the LUNA crash and the insolvency of 3AC and other large companies) may have caused the sell-off. This may mean that the bottom has already been reached. However, in the longer term, macro perspectives will likely continue to have a strong impact on the market.
Image credit: Shutterstock, Pixabay, Wiki Commons